Walht: combine close reading and inference skills to analyse text to learn more about the qualities of people known as heroes or leaders.
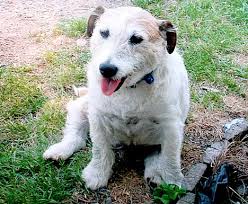
George the Jack russell followed the children to the shops and two Pit bulls came and tried to attack the young boy. George barked at them to give a warning. Unfortunately George got bitten badly and had to be put down. He was a hero.
He raced up to the Pit Bull dogs, barking to get their attention. This gave them children time to get away. This action showed that he was courageous and determined. George was a kind pet, who believed in helping others, helping the children showed that he cared about them. As a small Jack Russell terrier, he was an athletic dog and this meant he was very fit and fast. He used these skills with confidence.
A statue of George stands in the middle of his town known as Manania in Taranaki. He wears three medals awarded to him for his bravery.