Walht: find and continue a pattern - recording results in a table.
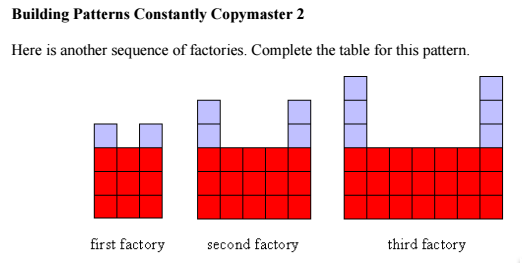
After analysing the pattern used for the tiles that make the factories, I create a table to
factory number
|
1
|
2
|
3
|
4
|
5
|
number of grey squares
|
2
|
4
|
6
|
8
|
10 (+2)
|
number of red squares
|
9
|
15
|
21
|
27
|
33 (+6)
|
number of all squares
|
11
|
19
|
27
|
35
|
43 (+8)
|
I have used the information in the table above to answer the questions below.
- How many grey squares do we need for the eighth factory?
16 grey squares
- How many grey squares will we need for the hundredth factory?
200
- What is the number pattern for the grey squares?
Add 2
- How many red squares do we need for the ninth factory?
54
5. If there are 14 grey squares how many red squares are there?
45
6. What is the number pattern for the red squares?
Add 6.
7. How do we get the number of red squares from one factory from the number of red squares in the factory before that?
3 red squares.
8. If we have to use exactly 36 red squares to making a factory, how many grey squares would we need?
5.5
9. How many squares do we need altogether for the seventh factory?
59
10. What is the number pattern that we are getting for the total number of squares?
+8
11. If we have 35 tiles, which numbered factory could we make?
4
12. Which of these numbers are not a number of squares of one of these factories: 20, 21, 22, 23
none of them above.
I entered the information into a spreadsheet


